Providing real time energy and emissions metrics internally to help create a culture of sustainability and expedite a remediation plan.
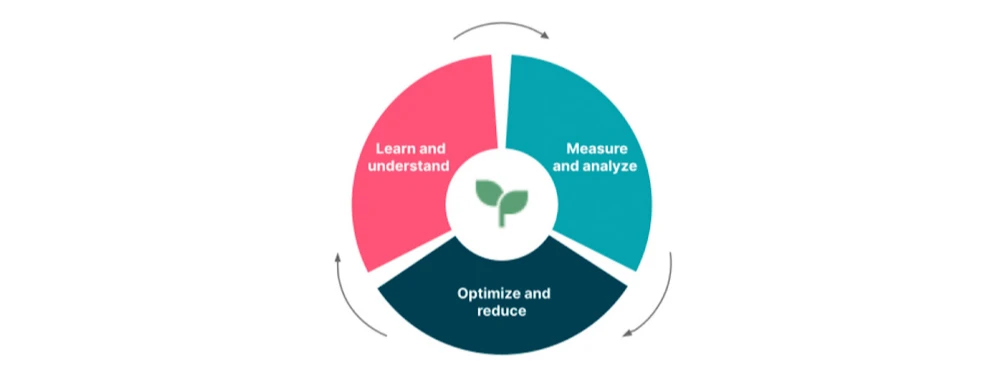
The basis of our approach revolves around the Green Software Fundamentals phases identified by the Green Software Foundation (GSF) of Learn, Measure and Reduce. These phases include understanding the emissions drivers and their relationships to each other; measuring and accessing the right data; and implementing the necessary optimization strategies to reduce an organization’s carbon footprint.
To make sense of emissions metrics and why certain cloud services may be more or less carbon-intensive, it is important to have a fundamental understanding of green software principles, emissions drivers and the broad domain of sustainability in tech. Principles ranging from carbon efficiency to energy proportionality are essential for our platform engineers to understand when looking to optimize their Google Cloud infrastructure.
We believe it is essential for organizations to have access to real-time energy and emissions metrics. The key here is to ensure that data on cloud cost, usage, and carbon footprint is available both historically and retrieved daily, so that our platform teams have both context and short feedback loops for the decisions they make.
Being able to view carbon emissions data in custom charts and dashboards not only allows for casual monitoring, but can also provide clarity for a number of different personas ranging from practitioners who have direct control over their cloud infrastructure, to executive level decision makers who can use the visualizations to tell a compelling story of opportunities to cut cloud costs and emissions.
After obtaining access to real-time data and enabling casual monitoring via dashboards, the natural next step is to more deeply analyze spikes and trends and ultimately, identify opportunities to implement strategies to mitigate emissions and lower costs. We have found that tagging or labeling cloud resources enables practitioners to assess the cost and emissions impact at a more granular resource level with metadata, and make the connection between carbon and meaningful groupings to identify exact pain points or opportunity areas.
Through sufficient analysis, our Thoughtworks teams are able to consider ways to reduce their cloud carbon footprint, and identify remediation strategies that would be most fitting for their objectives, requirements, and infrastructure needs.
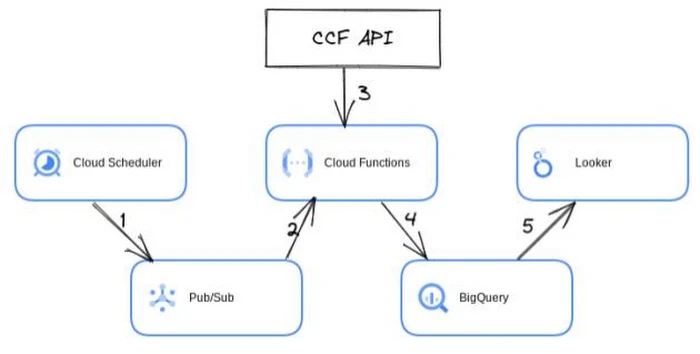
Cloud Scheduler triggers a Pub/Sub message daily. That message is consumed by a Cloud Function that hits the CCF API with a query for one day’s worth of data. This function pushes this data upstream, appending it to a BigQuery table. That table is then consumed by Looker Studio and joined with billing export data for many different visualizations.
What are the results of what we’re doing?
Grabbing cloud carbon estimations through CCF open source software and using Google Cloud services
After enabling a centralized team at Thoughtworks to consume CCF data using cloud billing data, dashboards were made broadly available for internal teams so they could view and monitor their historic and daily cloud emissions metrics. This newfound transparency and access to real-time data enabled teams to identify spikes and trends, and to automate recurring emissions reports to notify teams of any remedial actions they needed to take.
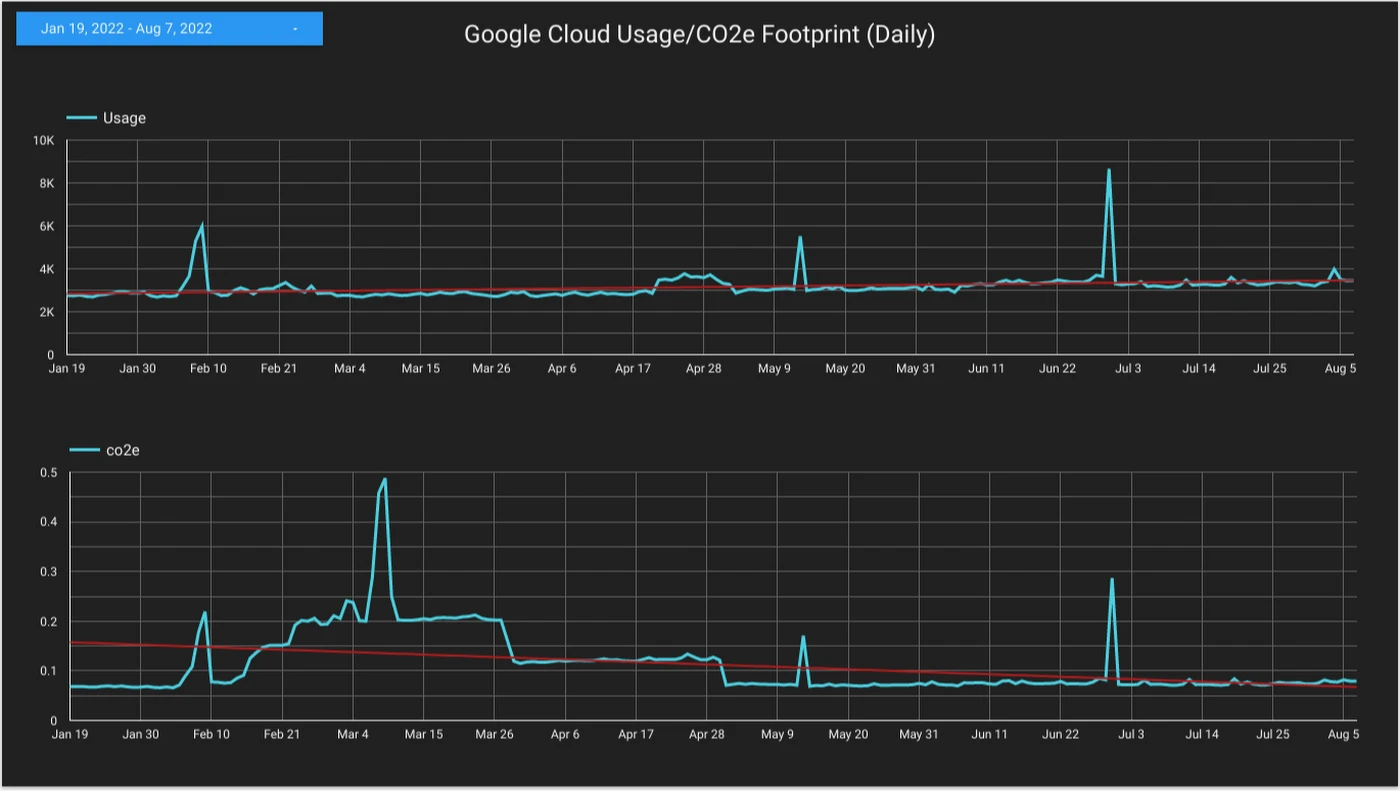
Let’s look at an example. In the following chart we can see three usage spikes and four emissions spikes. We can conclude at least two things from this. First, cost of usage is not a perfect proxy for emissions. There’s a big spike in emissions in early March with no corresponding rise in cost. Second, we know we should really drill in and understand what happened in February and March. In fact we did this, which is how we were able to resolve the spike.
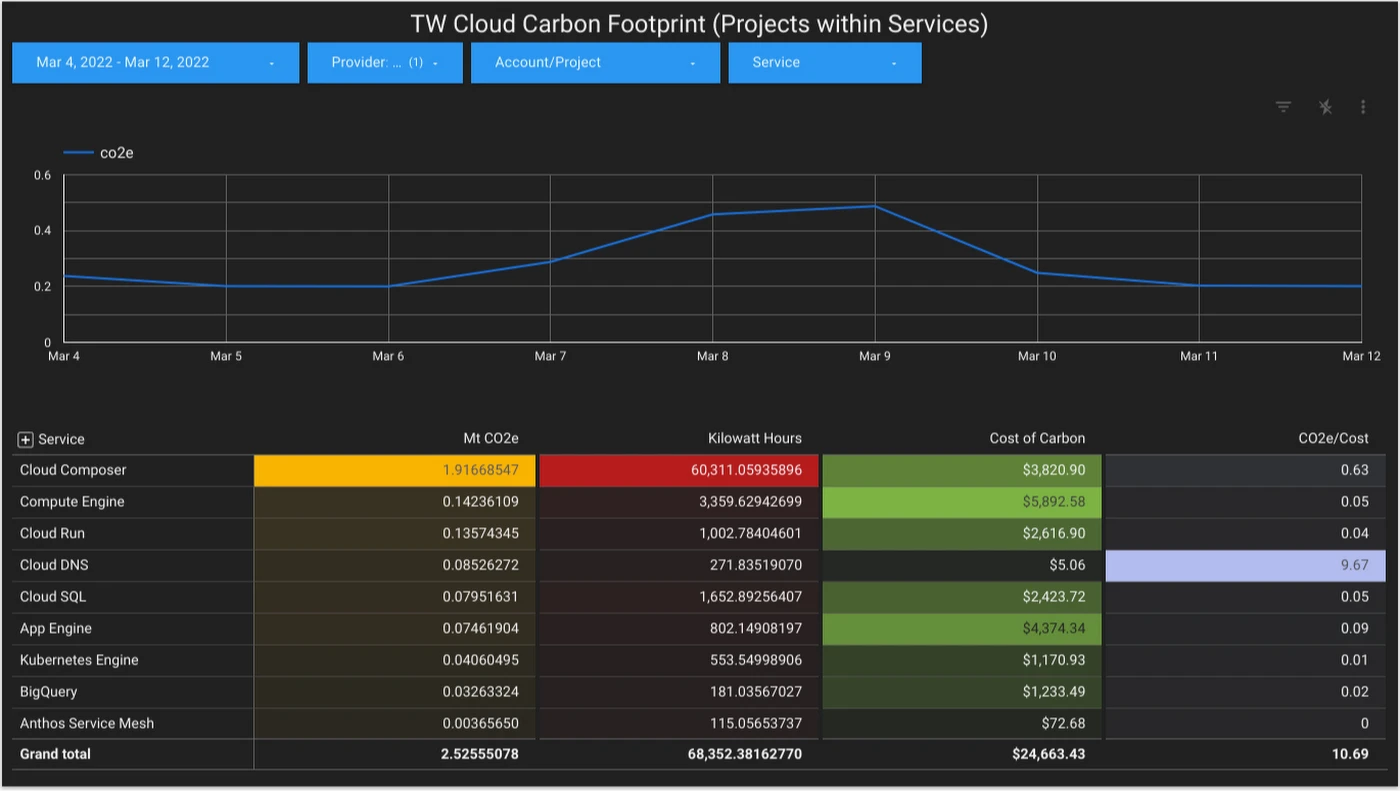
Let’s use a chart that shows us emissions by cloud product over time. Narrowing the scope to Mar 4 through Mar 12 gives us this:
This is the time span covering the tallest point of our largest spike in emissions. We can see the product contributing most of our emissions bulge is Cloud Composer. Looking deeper we learn that three Google Cloud projects are contributing 90% of this. We reached out to the teams responsible for these projects. Tuning commenced.
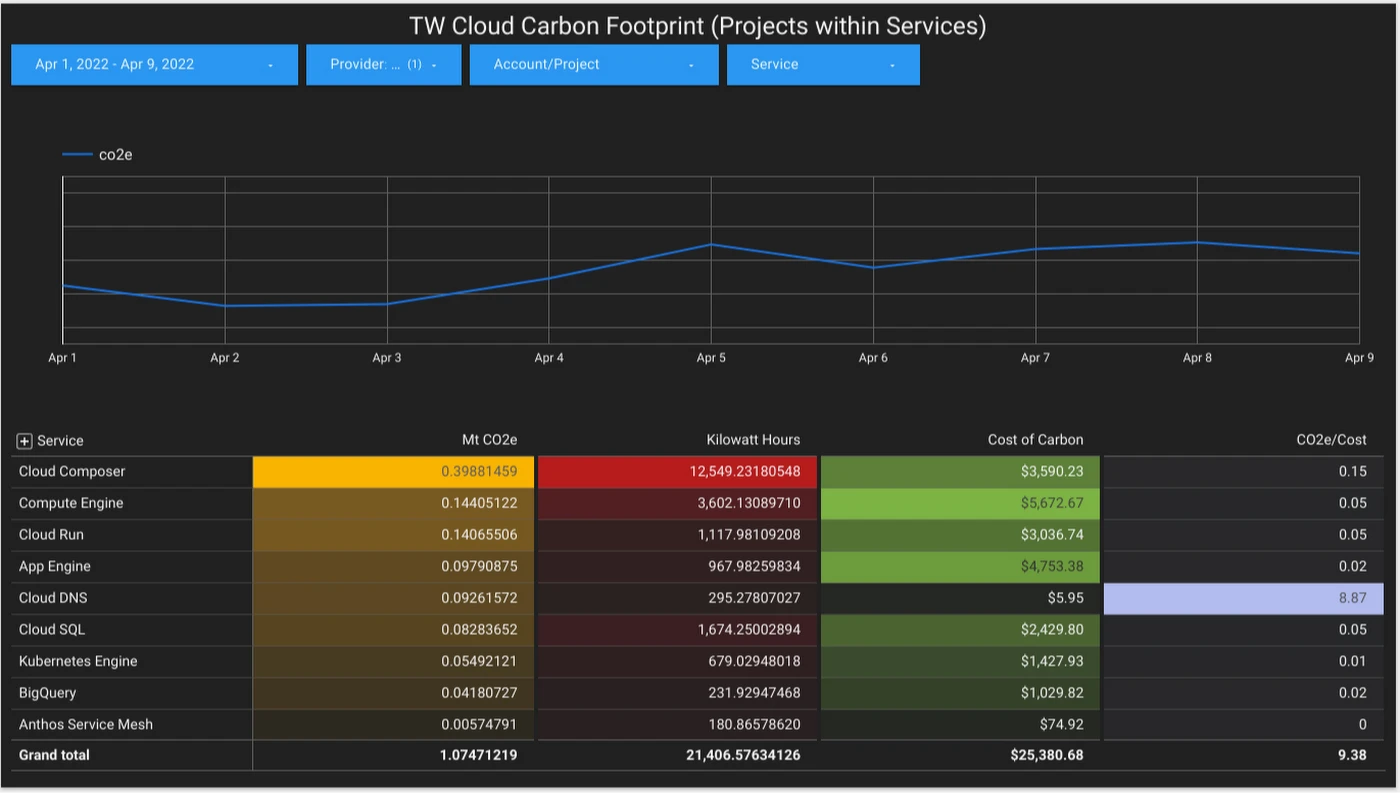
Now, looking at the situation four weeks later we find a much narrower gap between Composer and Compute Engine. Estimated emissions from the use of Composer have been reduced substantially.
Picture a more sustainable organization